The Friction Matrix: Visualising the Cost of Tech Debt
This post outlines a practical, data-driven method for understanding how technical debt impacts upcoming deliverables. It helps teams and their stakeholders quantify where debt is creating the most friction so they can prioritise work to tackle it effectively.
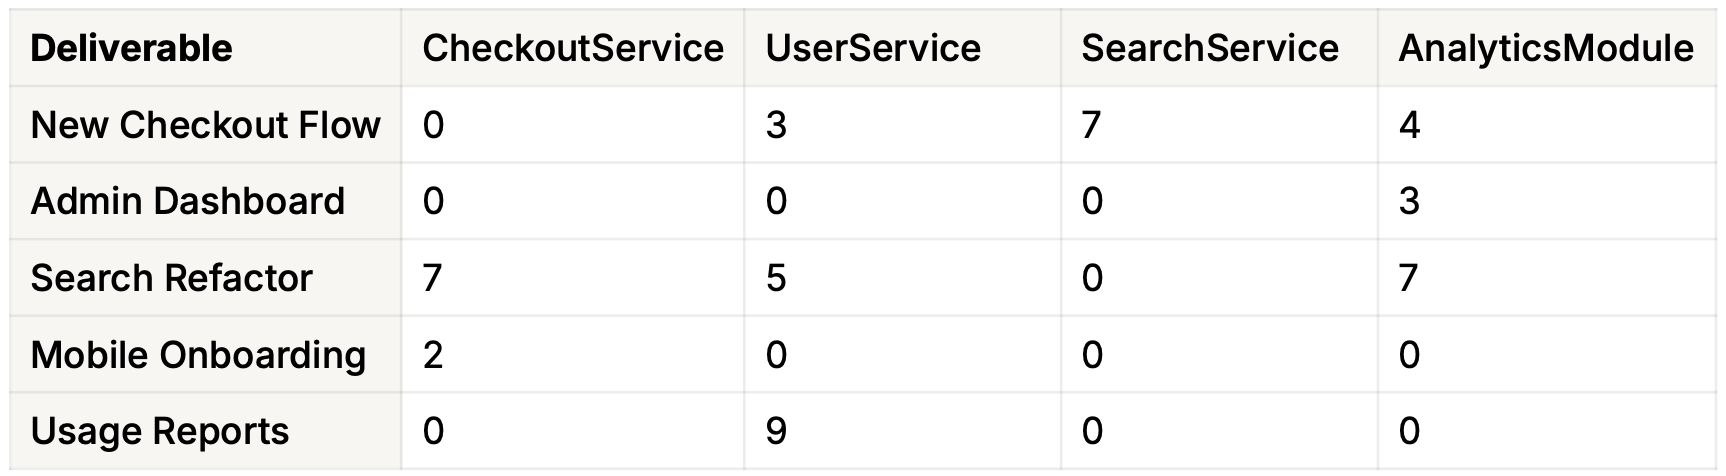
Step 1: Map Deliverables to Components (Effort)
We start by mapping each planned deliverable to the components it will touch. For each deliverable, assign effort scores from 1 to 10 that reflect how much work will be required in each component to implement the deliverable.
Example
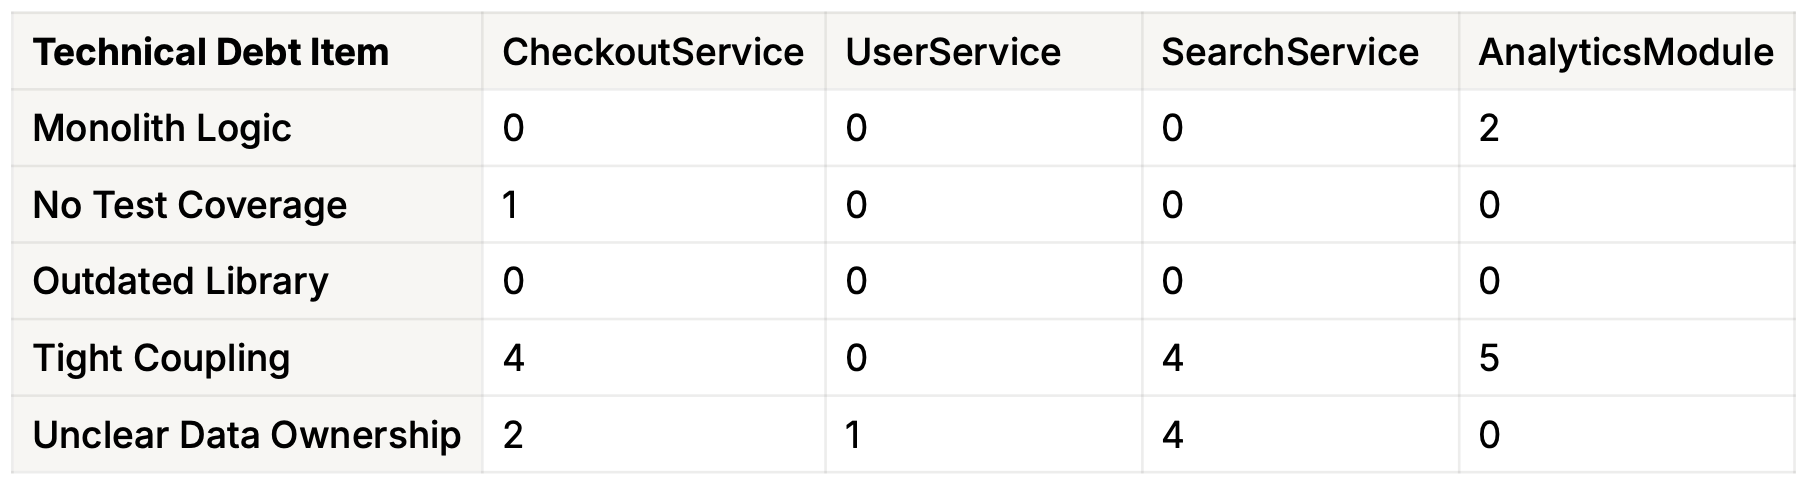
Step 2: Map Technical Debt to Components (Impact)
Separately, associate each known technical debt item with the components it affects. Do this by assigning an impact score from 1 to 5 that reflects the severity of the friction introduced on the component by the debt.
Example
Step 3: Compute the Friction Matrix (Deliverables × Debt Items)
We compute the friction score for each deliverable and debt item using matrix multiplication:
F = E × Iᵀ
Where:
Fis the Friction Matrix (Deliverables × Debt Items)Eis the Effort Matrix (Deliverables × Components)Iis the Impact Matrix (Debt Items × Components)
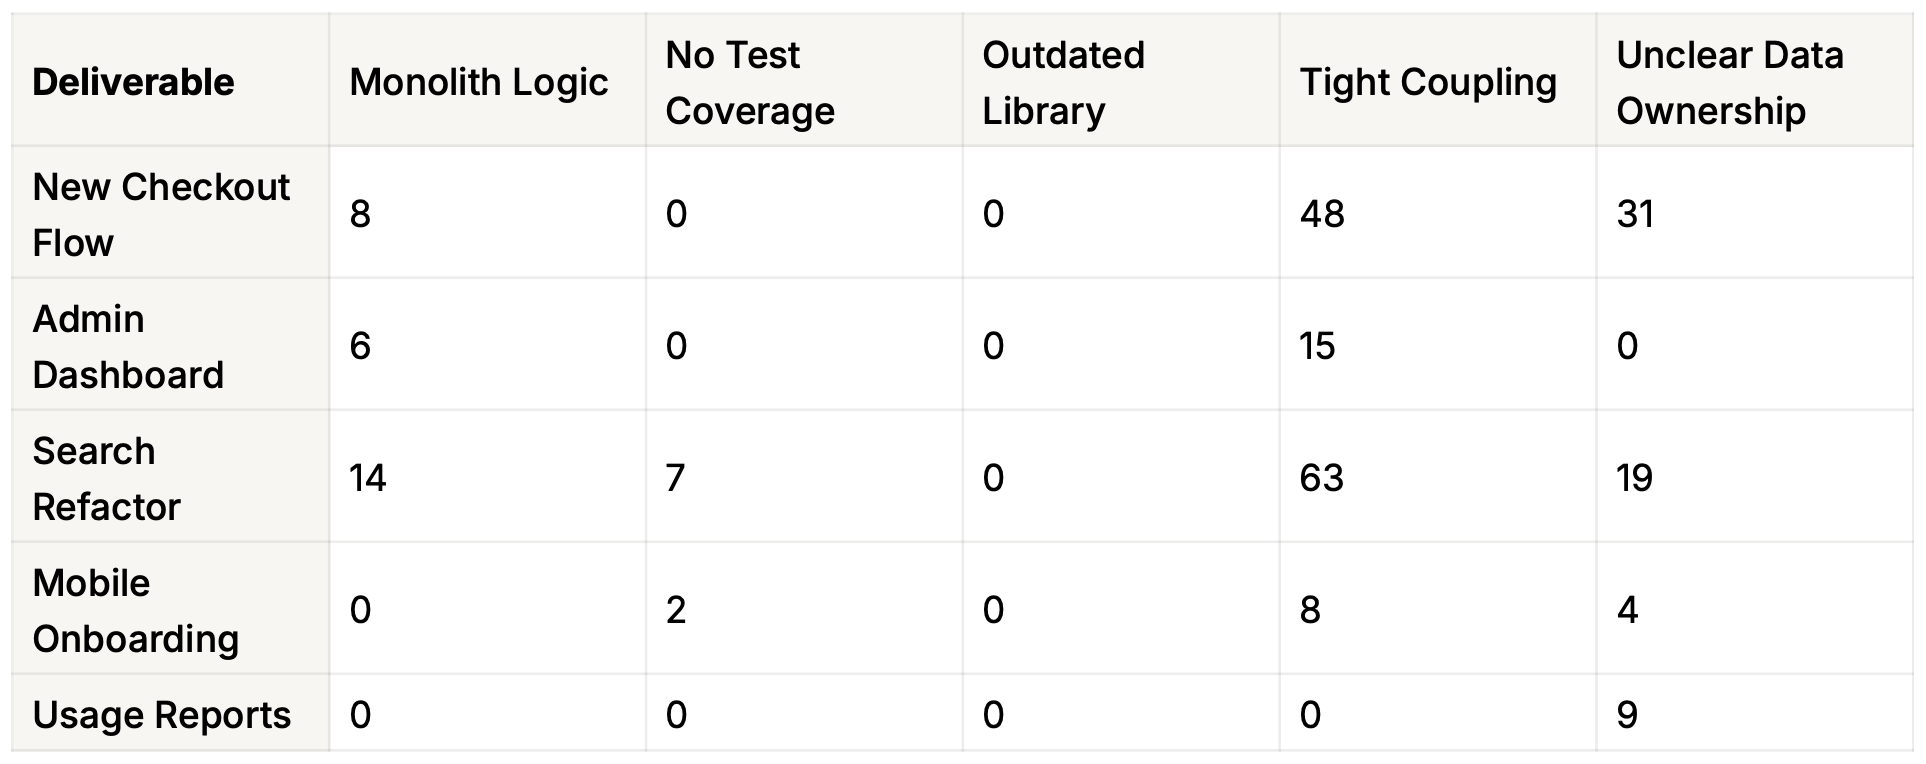
Why this works
Each component acts as a bridge between roadmap work and technical debt. If both a deliverable and a debt item are linked to the same component, the friction score accumulates.
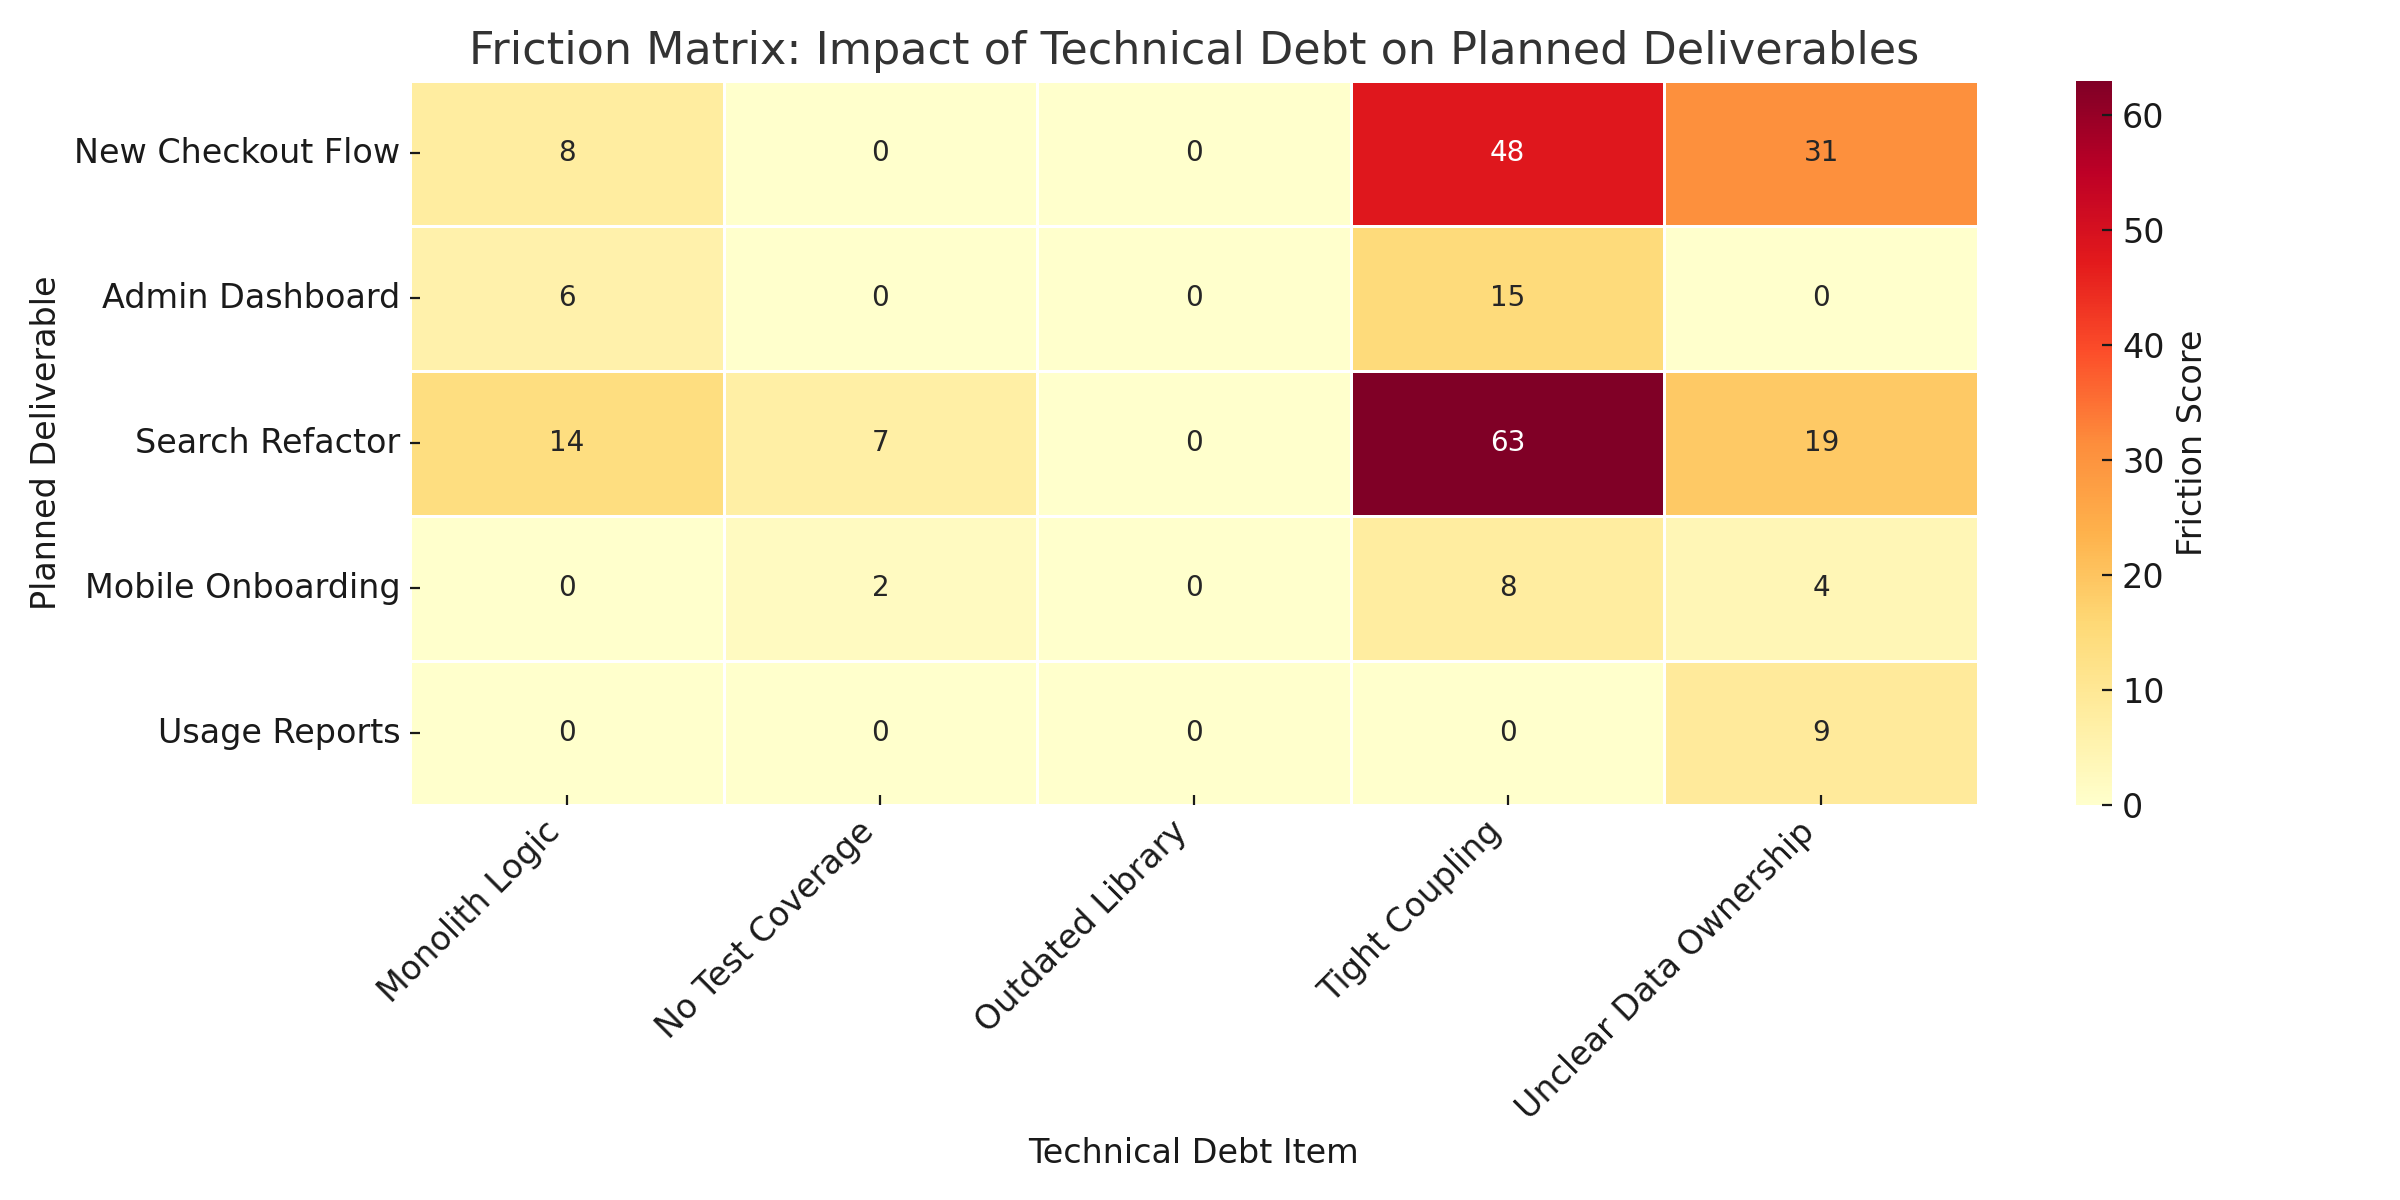
Step 4: Translate Friction into Delivery Strategy
We can now visualise the friction matrix as a heatmap to help teams and stakeholders align on priorities and make informed trade-offs between feature work and tech debt.